product design
& data viz
Designing Explainable AI for Real Decisions
How do you design AI systems people can actually understand and explain? This project explores explainable AI as a designed experience—combining cohort analysis, visual explanations, and a guided conversational layer to support trust, validation, and decision-making. Built with Claude Code. View project overview →

How Oscar Nominations Connect
Explore the hidden relationships between Academy Award categories.
Built with Claude Code and Cursor.

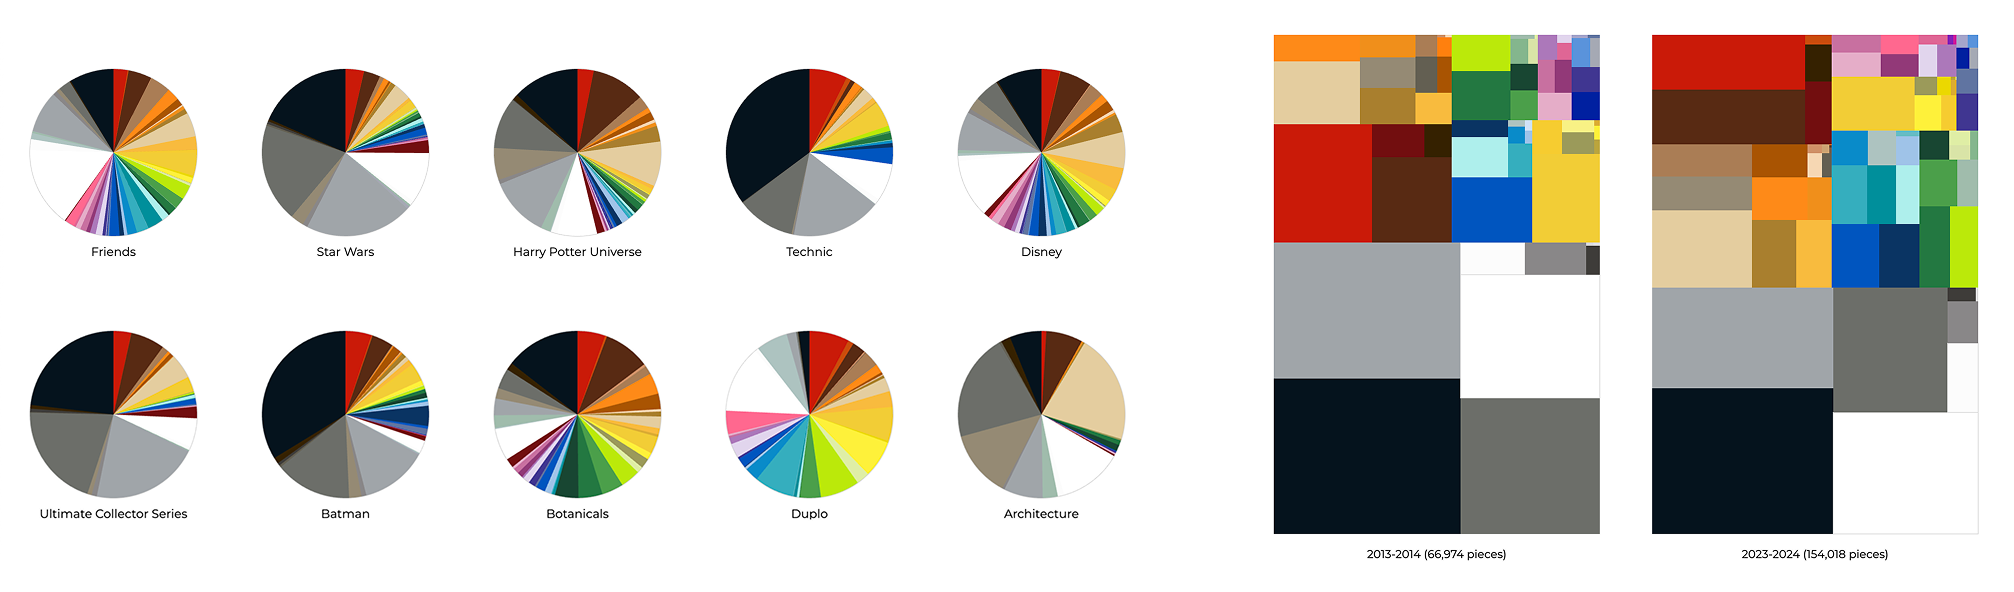
Is LEGO Going Gray?
Is LEGO going gray? How color palettes shift as more Lego sets target adults.
Built with GitHub Copilot and Cursor.
Lego Colors over the Years
Visualization showing Lego's color evolution from 5 to 120 colors across 72 years.
Fund Dashboard
Internal dashboard design providing overview and details of fund metrics and characteristics.
Baby Names
Visualization of the 50 most common US baby names from 1930 to 2014.
Songflow
Thesis project exploring tag-based music recommendations and discovery.
What is the Best Age to Win an Oscar?
Analysis of age patterns for Oscar winners across all acting categories.
Hi, I'm Juliana.
I’m a product and data visualization designer specializing in UX for power users working with complex, high-volume data—designing dashboards, analytics tools, and decision-support systems grounded in research and analysis.
Clients include Goldman Sachs, JPMorgan Chase, Morgan Stanley, and ADP.
This site is a space for personal explorations, where I treat code as a design medium, using AI-assisted tools to rapidly explore interaction patterns, data representations, and system behaviors—particularly in the context of explainable AI and model-informed decision-making.
To view my full professional portfolio or get in touch, email me at .